Note
Go to the end to download the full example code.
Star to Mineralogy Pipeline
The core workflow: create a star from spectroscopic dex measurements, view its composition, and calculate mantle mineralogy from a bulk silicate planet composition.
Create a Star
Stellar compositions are specified in dex notation — logarithmic abundances relative to the Sun. Positive values mean enriched, negative values mean depleted.
import matplotlib.pyplot as plt
import stellar_geology as sg
import pandas as pd

star = sg.Star(
    stellar_dex={"Fe": 0.1, "Mg": -0.05, "Si": -0.05},
    name="Example Star",
)

# View the star's composition as wt% oxides
composition = star.get_composition(units="wtpt_oxides")
print("Star composition (wt% oxides):")
for oxide, pct in composition.items():
    print(f"  {oxide}: {pct:.2f}%")
Star composition (wt% oxides):
  SiO2: 32.01%
  FeO: 46.02%
  MgO: 21.97%
Calculate Mineralogy
Given a bulk silicate planet composition (wt% oxides), CIPW normative mineralogy predicts the equilibrium mineral assemblage.
bsp = {"SiO2": 45.0, "Al2O3": 4.0, "FeO": 8.0, "MgO": 38.0, "CaO": 3.5}

mineralogy = sg.calculate_mineralogy(bsp)

print("Mantle mineralogy (molar fractions):")
for mineral, fraction in mineralogy.items():
    print(f"  {mineral}: {fraction:.4f}")
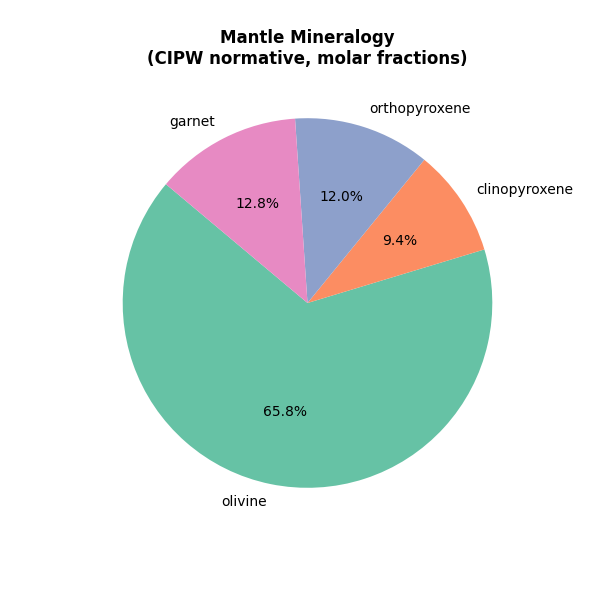
Mantle mineralogy (molar fractions):
  olivine: 0.1776
  clinopyroxene: 0.0255
  orthopyroxene: 0.0323
  garnet: 0.0346
Normalize for ternary plotting
The plot_norm function normalizes olivine, clinopyroxene, and orthopyroxene to sum to 1 — ready for a ternary diagram.
Ternary-normalized (ol + cpx + opx = 1):
  olivine: 0.7546
  clinopyroxene: 0.1082
  orthopyroxene: 0.1372
Visualize the mineral assemblage
A pie chart shows the relative proportions of each mineral phase in the predicted mantle.
# Filter out zero-fraction minerals for a cleaner chart
nonzero = {m: f for m, f in mineralogy.items() if f > 0}
minerals = list(nonzero.keys())
fractions = list(nonzero.values())

cmap = plt.colormaps["Set2"]
colors = [cmap(i) for i in range(len(minerals))]

fig, ax = plt.subplots(figsize=(6, 6))
ax.pie(
    fractions,
    labels=minerals,
    autopct="%.1f%%",
    colors=colors,
    startangle=140,
)
ax.set_title("Mantle Mineralogy\n(CIPW normative, molar fractions)", fontweight="bold")
plt.show()
# create a plot with stellar_geology's ternary plotting tool
fig = sg.ternary_plot(
    mineralogy,
    a="olivine",
    b="orthopyroxene",
    c="clinopyroxene",
    name="My mantle",
    width=800,
    title="Mantle Mineralogy (CIPW normative, molar fractions)",
    base_marker=dict(size=20),
    font=dict(size=15)
    )

fig
Total running time of the script: (0 minutes 0.113 seconds)