Note
Go to the end to download the full example code.
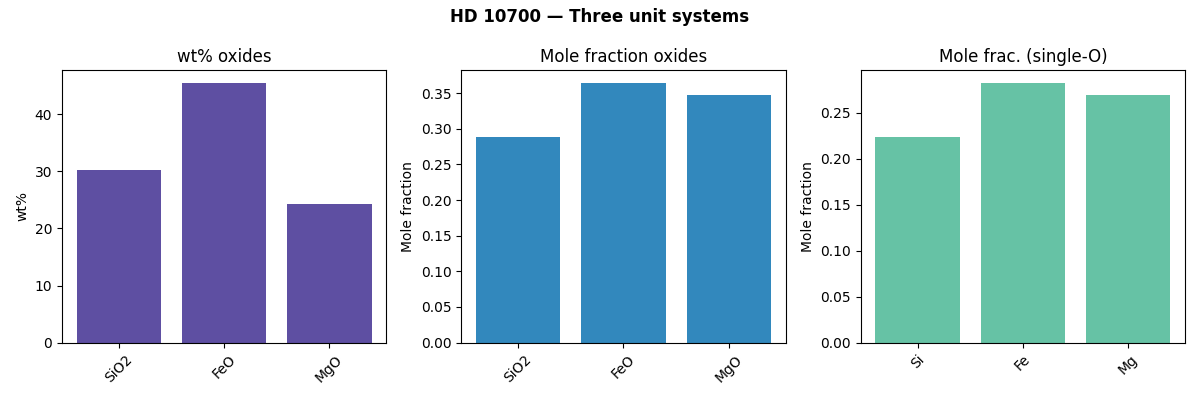
Composition Unit Conversions
The same stellar composition viewed in different unit systems. stellar_geology supports wt%, mol%, and mole fraction representations.
Start with a star slightly enriched in iron.
import matplotlib.pyplot as plt
import stellar_geology as sg

star = sg.Star(
    stellar_dex={"Fe": 0.15, "Mg": 0.05, "Si": -0.02},
    name="HD 10700",
)
Weight percent oxides
The most common representation in geochemistry.
wtpt = star.get_composition(units="wtpt_oxides")
Mole fraction oxides
Useful for thermodynamic calculations.
molfrac = star.get_composition(units="molfrac_oxides")
Mole fraction on a single-oxygen basis
Common in mineral physics and mantle geochemistry.
single_o = star.get_composition(units="molfrac_singleO")
Compare all three unit systems
The same composition looks quite different depending on the unit system. Weight percent emphasizes heavy oxides (FeO, SiO2), while mole fraction emphasizes the most abundant molecules.
fig, axes = plt.subplots(1, 3, figsize=(12, 4))

axes[0].bar(list(wtpt.keys()), list(wtpt.values()), color="#5e4fa2")
axes[0].set_title("wt% oxides")
axes[0].set_ylabel("wt%")
axes[0].tick_params(axis="x", rotation=45)

axes[1].bar(list(molfrac.keys()), list(molfrac.values()), color="#3288bd")
axes[1].set_title("Mole fraction oxides")
axes[1].set_ylabel("Mole fraction")
axes[1].tick_params(axis="x", rotation=45)

# Single-O basis uses element names (Si, Fe, Mg) rather than oxide formulas
axes[2].bar(list(single_o.keys()), list(single_o.values()), color="#66c2a5")
axes[2].set_title("Mole frac. (single-O)")
axes[2].set_ylabel("Mole fraction")
axes[2].tick_params(axis="x", rotation=45)

fig.suptitle(f"{star.name} — Three unit systems", fontweight="bold")
fig.tight_layout()
plt.show()
Total running time of the script: (0 minutes 0.541 seconds)